
Database Version: v2026.04.27 (Latest Refresh: April 27, 2026)
🎮 PC Bottleneck Calculator
The free bottleneck checker and calculator for gamers
Want to know How we Calculate our Results?
Ever wonder why your high-end GPU still delivers low FPS? Or why upgrading one part didn’t change anything? That’s a classic PC bottleneck.
This free Bottleneck Calculator instantly shows which part of your system (CPU, GPU, RAM, or storage) is limiting real-world gaming performance and how to actually fix it personalized to your needs.
No theory. No guessing. Just clear results and smart upgrade advice.
👉 Click the button, enter your specs, and see the bottleneck in seconds.
Some key features make it great
Everything you need to check bottleneck of your PC

Instant Bottleneck Detection
Get 99.99% accurate diagnostic results in seconds with no wait times.

Component-Level Analysis
Evaluates exact CPU, GPU, RAM, and Storage configurations.

100% Free & Secured
Web-based tool requiring zero sign-ins, zero software downloads, and zero paywalls.
Personalized Suggestions
Automated suggestions tailored to your specific system inputs and target resolution.
How the Bottleneck Calculator Works
How Does the Bottleneck Test Work?
Our checker calculates component synergy by cross-referencing your hardware combinations, display resolutions, and application workloads to pinpoint precisely which part limits the data stream of another.
How Accurate is the PC Bottleneck Checker?
Tested across real-world game engine simulations and verified by builders, our tool delivers an accurate engineering estimate. Note that performance balances can vary depending on individual application optimization, showing peak accuracy for gaming pipelines and common desktop component pairs.
How to Read Your Custom Performance Report
Our tool avoids giving you a single, vague number. Instead, your diagnostic dashboard updates into six clear, scannable panels:
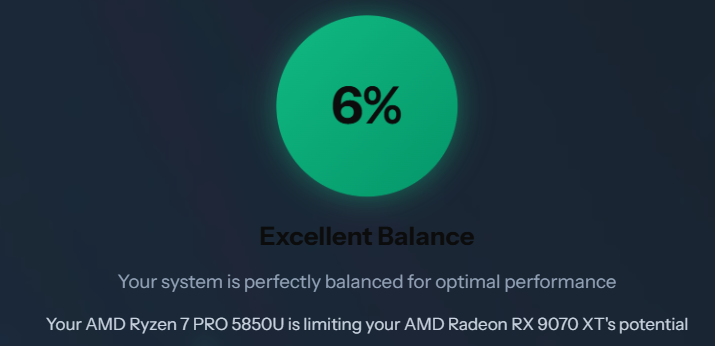
1. Overall Score
- What it is: The high-level summary showing the total performance variance between your parts.
- How to read it: A lower percentage indicates highly optimized hardware harmony; a higher percentage flags a clear processing bottleneck
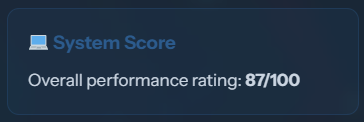
2. System Score
- What it is: A comprehensive evaluation of your PC’s raw power tier and processing capability as a whole.
- How to read it: This tells you where your machine ranks in the current global hardware landscape and how future-proof it is for upcoming software.
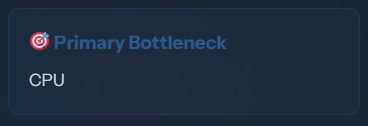
3. Primary Bottleneck
- What it is: The core diagnostic panel that instantly isolates the specific hardware component hitting its operational cap first.
- How to read it: It will explicitly tell you if your system configuration is running CPU-Bound or GPU-Bound, taking all the guesswork out of troubleshooting.
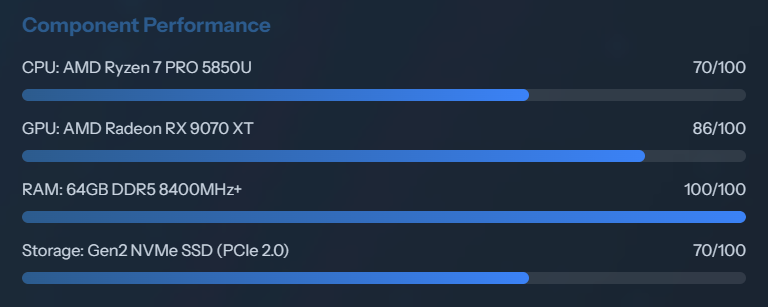
4. Component Performance
- What it is: A detailed look at how your specific CPU and GPU models are running relative to their maximum design limits.
- How to read it: Shows you exactly how much horsepower each individual part is contributing, pointing out which one has extra breathing room.
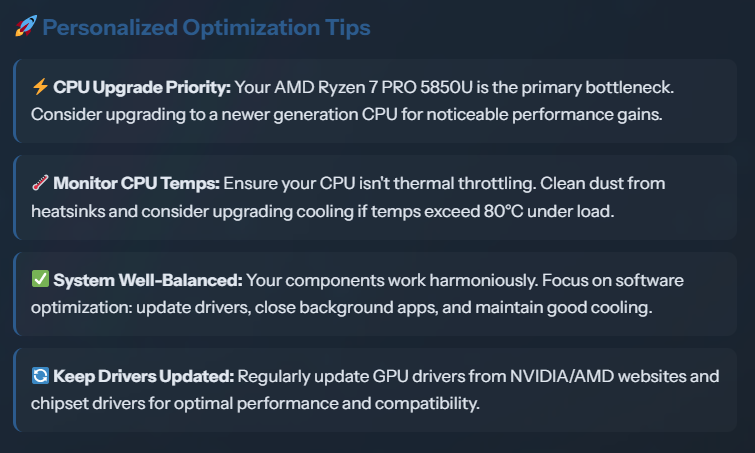
5. Personalized Optimization Tips
- What it is: An automated optimization checklist tailored specifically to your exact hardware combination.
- How to read it: Delivers direct, free action steps—like software configurations, driver updates, or in-game preset tweaks—to balance your load.
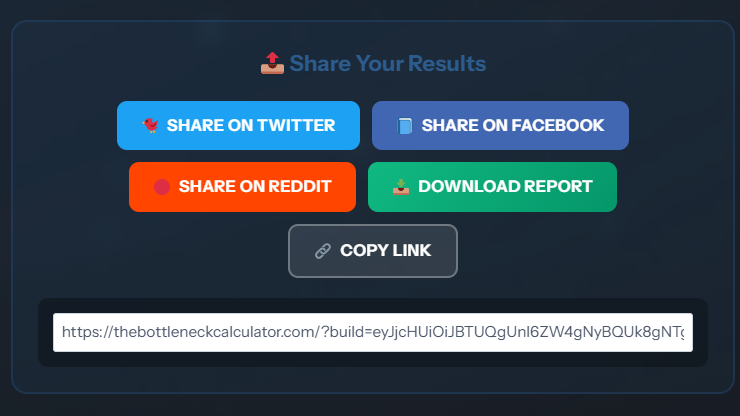
6. Share Your Results
- What it is: A feature that creates a clean, dedicated link to your unique hardware diagnostic blueprint.
- How to use it: Instantly share your calculation layout on tech forums like Reddit or Discord when asking the community for building or upgrade advice.
How Do I Interpret My Calculation Results?
To understand what your calculation means for real-world gameplay and productivity, map your score to these four verified architectural tiers:

0% to 10% (Perfect Balance):
Highly efficient component synergy. Your processor and graphics card are exceptionally well-matched. No hardware upgrades are necessary to clear performance paths.

10% to 20% (Minor Imbalance):
Minimal processing mismatch. While you might experience mild frame variance in highly unoptimized titles, your system will run smoothly across everyday workloads.

20% to 30% (Noticeable Limitation):
Clear structural bottleneck. One component is actively capping the capabilities of the other, resulting in lower average frame rates or visible micro-stutters.

Over 30% (Severe Mismatch):
Major hardware imbalance. Your parts are significantly mismatched, and an upgrade is highly recommended for the limiting part to unlock the true rendering capability of your setup.
Technical Analysis: The Impact of Hardware Mismatching
Tested Configuration Case: Intel Core i5-12600K + NVIDIA GeForce RTX 5080 at 1440p Resolution.
When component capabilities diverge significantly, raw benchmark metrics reveal exactly how a processing imbalance drops frame rates and degrades pacing delivery.
- The Resource Data: In processor-heavy titles, a mid-range CPU like the i5-12600K can pin at 100% utilization across its performance cores handling game logic and physics calculations.
- The System Restraints: Because the processor cannot send frame instructions down the PCIe lanes fast enough, the elite graphics card is starved for data, forcing the RTX 5080 to sit under-utilized at roughly 70% capacity.
- The Resolution Path: Upgrading the platform processor to a generation with higher single-core throughput balances the pipeline, letting the graphics card reach 98% utilization and clearing frame stutters.
Common Component Utilization Scenarios
When monitoring your computer’s real-time resource usage charts via software, your components will interact in one of several distinct processing configurations:
CPU Usage:
GPU Usage:
Scenario 1: High CPU & Low GPU Utilization (Processor-Bound State)🔴
- Technical State: Severe CPU Bottleneck (Processor-Bound)
- Under the Hood: Your CPU cores are flat-out running background logic and asset streaming, leaving your graphics card idling while waiting for instruction sets.
- Result: Capped average frame rates, prominent input lag, and choppy micro-stutters during intense action.
CPU Usage:
GPU Usage:
Scenario 2: Low CPU & High GPU Utilization (Optimal Graphics-Bound Gaming) 🟢
- Technical State: GPU Bottleneck (Graphics-Bound / Optimal Gaming State)
- Under the Hood: Your graphics card is working at peak efficiency, pushing out textures and pixels as fast as its architecture allows, while your CPU easily feeds it data.
- Result: Stable, fluid, and predictable frame delivery. You are extracting the maximum performance out of your graphics investment.
CPU Usage:
GPU Usage:
Scenario 3: 100% CPU & 100% GPU Usage (Maximum Hardware Limit) 🟡
- Technical State: Maximum System Cap (Total Hardware Limit)
- Under the Hood: Both components are pinned to their absolute engineering limits simultaneously. This occurs in highly optimized game engines built to extract maximum system power.
- Result: Maximum potential frame rates for your system, but your PC will run hot. There is zero background processing headroom left for other applications.
CPU Usage:
GPU Usage:
Scenario 4: Low CPU & Low GPU Usage (Software Engine Frame Lock)🔵
- Technical State: Software Engine Cap / Frame Lock Restriction
- Under the Hood: Neither component is being stressed, yet your performance remains capped. This is an engine or settings barrier, not a hardware mismatch.
- Result: Occurs if a title has a hard-coded internal FPS cap, if V-Sync/G-Sync is active matching a monitor’s refresh rate, or if the game code is unoptimized.
CPU Usage:
GPU Usage:
Scenario 5:High RAM or VRAM Allocation (Memory Capacity Bottleneck) 🟣
- Technical State: Memory Capacity Bottleneck
- Under the Hood: Your processing chips have extra power, but your memory allocation space is completely full. System RAM is forced to page data to a slower storage drive, or your GPU is running out of Video Memory (VRAM) for textures.
- Result: Sudden, violent drops in frame pacing down to single digits when crossing loading zones or rendering fresh map layouts.
CPU Usage:
GPU Usage:
Scenario 6: Low Overall CPU Usage but Maxed Core (Single-Core Engine Cap) ⚙️
- Technical State: Single-Core Engine Bottleneck
- Under the Hood: Task Manager shows low overall CPU usage, but one or two individual processor cores are completely pinned at 100%. The game engine cannot spread its tasks across modern multi-threaded setups.
- Result: Low GPU usage and capped performance, despite your overall utilization charts looking like they have plenty of room to spare.
CPU Usage:
GPU Usage:
Scenario 7: Declining Utilization + High Component Temperatures 🔥
- Technical State: Thermal Throttling (Cooling Limitation)
- Under the Hood: Your components are running too hot (typically hovering within the 85∘C−95∘C+ range). Built-in protective mechanisms automatically drop clock frequencies to prevent permanent hardware damage.
- Result: A game starts out running fast, but after 15 to 20 minutes of playtime, performance progressively degrades into heavy stuttering.
Common Causes of PC Bottlenecks
A bottleneck takes place when there is an imbalance of power between your components. While the interaction between your CPU and GPU forms the primary foundation of system balance, overall machine efficiency is highly dependent on secondary component variables:
- System Memory (RAM): Running insufficient RAM capacity or operating at low memory clock frequencies creates severe operational latency, slowing down your PC’s data flow and causing stutters during heavy tasks.
- Display Monitors: Pairing an elite graphics card with a legacy display (such as a 1080p 60Hz panel) creates an artificial system barrier because the monitor cannot physically display the frames the GPU renders.
- Storage Devices: Running modern software off an old mechanical Hard Disk Drive (HDD) starves your system of data. Upgrading to Solid State Drives (SSD) or high-speed NVMe infrastructure minimizes loading chokepoints drastically.
How Screen Resolution Impact Hardware Workloads
Display resolution is the single quickest way to shift processing weight between your hardware parts:
- At 1080p: Visual rendering requirements are lower, allowing your graphics card to process frames at extreme speeds. This shifts the processing burden squarely onto your CPU’s single-core speed to feed the GPU commands fast enough.
- At 1440p / 4K: Pushing higher pixel densities forces your graphics card to work exponentially harder for every single frame. The GPU hits its limit naturally, freeing up data headroom on your processor and shifting the machine into a comfortable graphics-bound state.
How to Fix and Resolve Hardware Bottlenecks
Discovering a system bottleneck doesn’t mean you must immediately buy expensive new parts. Adjusting your system environment can smooth out your frame delivery and balance resource distribution:
If Your System is CPU-Bound (Processor Limited):
Permanent Fix: Upgrade your CPU to a newer generation with higher single-core performance.
Quick Fixes: Lower processing-heavy settings (draw distance, environmental physics), close demanding background tray tasks, increase resolution scaling to shift weight to the GPU, or cap your maximum frame rate to match your monitor’s native refresh rate.
If Your System is GPU-Bound (Graphics Card Limited):
- Permanent Fix: Upgrade your graphics card to a modern architecture with increased VRAM and bandwidth options.
- Quick Fixes: Reduce graphic quality presets, lower your target display resolution, disable demanding shaders like Ray Tracing, leverage intelligent upscaling profiles (DLSS, FSR, XeSS), and ensure your graphics drivers are updated directly from the manufacturer.
If Your System is Memory or Storage Bound:
- RAM Fix: Upgrade to dual-channel memory configurations, scale capacity up (e.g., 8GB to 16GB or 32GB), activate memory performance profiles (Intel XMP or AMD EXPO) within your motherboard BIOS, and shut down memory-hungry applications.
- Storage Fix: Migrate your operating system and primary game files from legacy HDDs to fast SATA SSD or high-speed NVMe storage options. Always maintain around 10%−15% allocation headroom on solid-state drives to prevent internal slowdowns.
The Impact of Overclocking and Component Upgrades:
- Strategic Overclocking: Modest overclocking can reduce a CPU restriction by roughly 5%−15%, and a GPU restriction by 5%−10%. However, this requires adequate system cooling, draws more power, and generates excess heat, which can risk system longevity if not kept stable.
- Hardware Upgrades: Upgrading a bottlenecked part is the only permanent solution to clear a severe imbalance. However, ensure you balance your choice; upgrading a component too far can simply flip the bottleneck onto the opposing part if it is a significantly slower model.
Balanced PC Builds to Avoid Bottlenecks (2026 Tier Guide)
Achieving true platform synergy requires pairing processors and graphics cards from complementary architectural eras. To assist you in planning your next hardware upgrade or system assembly, our database tracks three optimized configuration baselines across distinct budget tiers to eliminate structural choke points:
Core Hardware Component | Entry-Level Tier (1080p Balanced) | Mid-Range Tier (1440p Sweet Spot) | High-End Gaming/Workstation Tier (4K Elite) |
|---|---|---|---|
Processor (CPU) | AMD Ryzen 5 7600X or Intel Core i5-14600K | AMD Ryzen 7 9700X or Intel Core Ultra 5 245K | AMD Ryzen 7 9800X3D or Intel Core Ultra 9 285K |
Graphics Card (GPU) | NVIDIA RTX 4060 (8GB) or AMD RX 7600 XT | NVIDIA RTX 5070 (12GB) or AMD RX 8700 XT | NVIDIA RTX 5080 / 5090 (16GB+) or AMD RX 8900 XTX |
System Memory (RAM) | 16GB DDR5 (5600 MT/s) | 32GB DDR5 (6000 MT/s) Dual-Channel | 64GB DDR5 (6400 MT/s+) Low-Latency |
Primary Storage Drive | 1TB PCIe 4.0 NVMe M.2 SSD | 2TB PCIe 4.0 NVMe M.2 SSD (7000+ MB/s) | 2TB/4TB PCIe 5.0 Next-Gen NVMe M.2 SSD |
Target Hardware State | 0%–5% Variance at 1080p Ultra | 0%–3% Variance at 1440p High/Ultra | 0% Variance at 4K Ultra / VR / AI Local Compute |
Estimated Price Range | $700 – $900 | $1,300 – $1,600 | $2,500 – $3,500+ |
Why Choose Our Bottleneck Calculator? How We Compare
Many legacy calculators found on search engines run on outdated component metrics or force users to install background tracking utilities to check their specifications. Our platform is engineered differently:
Core Capability | Traditional Online Calculators | Our Diagnostic Platform |
|---|---|---|
Modern Component Data | ❌ Outdated. Uses old database tables that fail to accurately weight modern multi-layered architectures. | 🚀 Fully Updated. Core parameters are continuously updated to handle current processing instruction sets and architectures. |
System Privacy & Security | ⚠️ Risky. Forces users to download insecure desktop applications (.exe) to scan their active hardware profiles. | 🔒 100% Web-Based. Requires no local software tracking, safeguarding your private files and operating system data. |
Diagnostic Context | ❌ Vague. Displays a solitary, non-contextual percentage value that leaves you guessing how to handle it | 📊 6-Tier Detailed Report. Breaks down your result screen into distinct component, utility, and target insights. |
Resolution Adjustments | ⚠️ Flat-Rate. Calculates the exact same balance ratio whether you target low resolutions or high-density 4K displays. | 🎯 Dynamic Scaling. Readjusts calculations based on how workloads transfer across varying pixel configurations. |
How the Calculator Assesses Performance Factors of your PC:
Our calculator uses an advanced, web-based architectural logic engine. Instead of scanning your physical computer files in real-time, the algorithm evaluates the theoretical limits and processing structures of the components you select through a clean three-tiered technical check:
1. Processor (CPU) Throughput Vectors: The algorithm looks far beyond basic clock speeds (GHz). It analyzes Instructions Per Clock (IPC) based on chip generation, Core & Thread Allocation layouts, and Cache Architecture (L2/L3 Cache) sizes which govern raw data latency speeds.
2. Graphics Card (GPU) Rendering Vectors: The engine processes the total parallel processing clusters (like CUDA cores or Stream Processors), core clock speeds, VRAM Capacity, and Memory Bus Width (GB/s) to track texture storage pipelines.
3. Simulating Game-Engine Workloads: The tool introduces your chosen resolution and use-case parameters into a dynamic calculation matrix. It scales up the GPU data requirement exponentially as resolution rises (1080p→4K), while keeping baseline game physics requirements steady.
Platform Capability Restrictions:
📊 Note on Platform Capabilities: This bottleneck calculator is engineered specifically with Desktop Gaming PCs in mind. While you can utilize it to analyze specialized workstations or systems with rare components, the baseline models specialize in gaming ecosystem pipelines. Furthermore, this tool does not support consoles like the PS5 or Xbox Series X, as closed console architectures utilize fixed, unified memory configurations that do not process data like modular desktop computers.
Key Considerations When Evaluating Bottleneck Calculations
Hardware calculations are meant to serve as an expert engineering guide rather than an absolute, unyielding rule. To get the most accurate context from your calculation report, keep these considerations in mind:
- Scores are Relative, Not Absolute Drops: A “15% bottleneck” doesn’t mean your machine runs 15% slower across the board. It simply means that under peak operational loads, one component has roughly 15% more theoretical processing headroom than the other.
- No Real System Runs at 0% Continuously: It is physically impossible for a custom computer setup to maintain a perfect 0% resource balance across every single second of operation. Workloads shift instantly depending on game optimization, map scales, and engine rendering styles. A variance anywhere between 0% and 12% is considered a perfectly balanced machine.
- Keep Tracking Regular: We recommend running a system calculation layout whenever you experience persistent in-game frame drops, when preparing to upgrade an existing component, when downloading next-generation software applications, or once a year to verify overall system efficiency.
Best Practices for Avoiding Bottlenecks

Matching CPU & GPU Performance
When building your setup, make sure to pick hardware from matching performance tiers. Well-balanced example pairings include: an Intel Core i5-13600K with an NVIDIA RTX 4070, an AMD Ryzen 7 7800X3D with an NVIDIA RTX 4070 Ti, or an Intel Core i7-13700K with an AMD Radeon RX 7800 XT.
Choosing the Right Amount of RAM
Pair your system with adequate capacity and clock speeds to ensure data pipelines stay clear. Modern platforms thrive with at least 16GB to 32GB of low-latency DDR5 configurations.
Picking Storage for Speed & Capacity
Never compromise your storage pipeline. Choose high-tier solid-state storage to match your CPU’s speed capacities

Selecting a Display That Matches Hardware Power
For high-end component setups, leverage advanced displays such as 1440p or 4K monitors with a 144Hz+ refresh rate. For budget configurations, matching them with a clean 1080p 60Hz–75Hz monitor avoids exposing processing gaps.
Example Balanced Blueprints:
- Balanced Gaming Build: AMD Ryzen 5 7600X, NVIDIA RTX 4070, 16GB DDR5 RAM, 1TB NVMe SSD, paired with a 1080p 144Hz monitor.
- Balanced Workstation Build: Intel Core Ultra 5 245K, NVIDIA RTX 4070, 32GB DDR5 RAM, 2TB NVMe SSD, paired with a 1440p 144Hz display panel.
Power Supply Unit (PSU) Considerations
When optimizing hardware or planning an upgrade path to avoid performance crashes, ensuring your system has a reliable power envelope is vital. Insufficient power delivery can cause sudden system shutdowns under peak utilization loads, mimicking hardware failures. Review these popular power supply capacities based on your targeted configuration builds:
- 500W–600W Units: Ideal for Entry-Level Tier builds (e.g., Ryzen 5 paired with an RTX 4060 class configuration).
- 700W–800W Units: The sweet spot for Mid-Range Tier builds handling increased power draws from components like an RTX 5070 configuration.
- 800W–1200W+ Units: Absolute requirement for High-End Elite tiers to safely power flagship architectures like the RTX 5080/5090 paired with multi-threaded enthusiast processors.